Every person has some sort of glitch in them that makes them pay attention to the most stupid/unnecessary things in life, OCD or non OCD. For me, that's the uniforms and logos of professional sports teams. I'd always liked looking at NFL & MLB helmets at a young age and wondering what exactly the Atlanta Thrashers logo was (I must admit, that took too long for me to figure out). I'd always choose to be a different baseball team for rec ball so I could collect every team.
Logos have been fascinating me for years. My obsession for them increased when I came across Paul Lukas' Uni-Watch blog (he also writes season previews for ESPN) that covered everything when it came to uniforms and logos. I became one of those people that saw a missing patch or noticed someone was wearing the wrong socks during games. I've matured more to just the logo side of things. I currently pour over Chris Creamer's SportsLogos website. A library of 20,000+ logos for lax, baseball, football, basketball, hockey, soccer, olympics, rugby, & college sports.
So out of my enjoyment in logos & sports play, I started a little study of this stupid/unnecessary thing of life. A study to see which primary logo for each team was the most/least successful. I've started with the MLB in the American League, featuring the beautiful logo that is this, and the WTH?
So here, I will present the best/worst logos for each team. In order to qualify for either spot, each logo had to be in use for at least 3 years. Aside from that, it all was played out on the diamond. Enjoy!
BALTIMORE ORIOLES
Worst:

1999-2008: .440 Winning %
Logos have been fascinating me for years. My obsession for them increased when I came across Paul Lukas' Uni-Watch blog (he also writes season previews for ESPN) that covered everything when it came to uniforms and logos. I became one of those people that saw a missing patch or noticed someone was wearing the wrong socks during games. I've matured more to just the logo side of things. I currently pour over Chris Creamer's SportsLogos website. A library of 20,000+ logos for lax, baseball, football, basketball, hockey, soccer, olympics, rugby, & college sports.
So out of my enjoyment in logos & sports play, I started a little study of this stupid/unnecessary thing of life. A study to see which primary logo for each team was the most/least successful. I've started with the MLB in the American League, featuring the beautiful logo that is this, and the WTH?
So here, I will present the best/worst logos for each team. In order to qualify for either spot, each logo had to be in use for at least 3 years. Aside from that, it all was played out on the diamond. Enjoy!
BALTIMORE ORIOLES
Worst:
1999-2008: .440 Winning %
This is the 2nd youngest primary for the O's that encapsulated the end of Cal Ripken Jr.'s incredible career.
 1912-1930: .472 Winning %
 2009-2013 (Present): .543 Winning %
 1932-1935: .402 Winning %
 1912-1917: .551 Winning %
 1973-1979: .471 Winning %
 1946-1950: .552 Winning %
 1994-2005: .409 Winning %

1908-1915: .553 Winning %
 1975-1993: .448 Winning %
 1995-1999: .556 Winning %
 1969-2001: .502 Winning %

 1965-1970: .477 Winning %
 2005-2013 (Present): .554 Winning %
 1976-1986: .461 Winning %
 1961-1969: .542 Winning %
Best:
 1966-1988: .557 Winning %
In this stretch, Baltimore won and lost 3 world series'.
Worst:
The present logo at the beginning of the Curse of Bambino.
Best:
The current primary for the Sox, although this will likely end up not being the best if they keep up this year's losing ways.
Worst:
The White Sox never managed a winning record in this timespan & went through 2 managers (Fonseca/Dykes).
Best:
Here was one World Series win & one losing year.
Worst:
This is the first of two primary logos for Cleveland that suffered a losing career record.
Best:
A World Series was one in '54 in a sweep over the New York Giants.
Worst:
One of my personal favorite Tigers' logos ended up by far being the worst when it came to actual baseball. Smart idea considering they went to the World Series a couple years after changing it.
Best:
1908-1915: .553 Winning %
Although it just might be something someone drew & colored in with a random pen (or ink & quill?), 2 World Series were reached, but both lost (1908 & 1909).
Worst:
Even though this is the worst one that fits the qualifications, in a few years time it'll probably be the current 'Stros primary that takes the bottom spot (.315 winning % last year, are 39-54 as of 7/10/2014).
Best:
Despite being the most winning logo, it also was extremely talented at losing when it really counted with 3 straight ALDS exits.
Worst:
2002-2013 (Present): .425 Winning %
The Royals are only on their second primary logo. This one.
Best:
They barely nudged out a winning record in this long stretch.
Worst: IT'S A TIE!
1961-1964: .477 Winning %
Coincidentally, the next logo also had a .477 winning %, but was only used for two years (1971-1972).
Best:
Another current logo at its best; but alas, no World Series. Yet they've had a row of incredible players: Trout, Hunter, Wilson, & Rodriguez just to name a few.
Worst:
So much for a logo that says 'Win! Twins!'
Best:
The inaugural Twins logos was a success, and got them 1 win away from a World Series.
Worst:
1947-2013 (Present): .582 Winning %
So this one is completely backwards in an obvious way. But this is only the Yankees' second primary logo since the franchise began in 1913. This 'worse' logo has produced 17 of the 27 World Championships for the Bronx Bombers, and has seen the likes of Berra, Mantle, Gehrig, Mattingly, DiMaggio, and Posada.
Best:
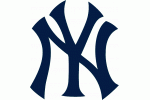 1913-1946: .587 Winning %
As you can see, its only a .005 difference between the two logos, but here lies 10 World Championships and the source of the Curse of Bambino.
OAKLAND ATHLETICS
Worst:
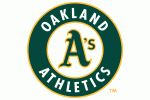 1993-2013 (Present): .516 Winning %
A bad stretch and a lot of nobody's has still resulted in Oakland having a worse logo in winning ways, only to improve after this years fantastic campaign.
Best:
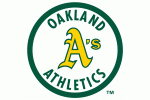 1983-1992: .538 Winning %
A very similar logo to the one above, here lies 3 straight World Series & one Championship. Maybe a Fingery mustache....
SEATTLE MARINERS
Worst:
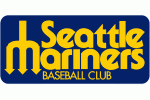 1977-1979: .386 Winning %
Being an expansion club, it definitely took a few years for the Mariners to get off the ground. But that trident still rules.
Best:
 1993-2013 (Present): .520 Winning %
The current Mariner logo houses one of the best seasons ever seen in this generation. The 2001 team mustered an impossible 116-win season, tied with the 1906 Chicago Cubs for the greatest season in baseball history. They also hosted the All-Star Game that year with 6 all-stars of their own.
TAMPA BAY RAYS
Worst:
 2001-2007: .392 Winning %
It took quite awhile for any significant progress to be made in the Trop. Despite having Fred McGriff, Aubrey Huff & Randy Winn, wins didn't abide here.
Best:
 2008-2013 (Present): .561 Winning %
Maybe knocking the devil out of Tampa helped a bit. 2008 featured a World Series appearance against the Phils, but still no championships.
TEXAS RANGERS
Worst:
 1984-1993: .480 Winning %
This losing stretch had itself some fun though, hosting the Ryan Express from 1989-1993.
Best:
 2003-2013 (Present): .522 Winning %
Ron Washington has mostly had his ways in Arlington, recently making 2 straight World Series appearances while having ownership issues.
TORONTO BLUE JAYS
Worst:
 1977-1996: .490 Winning %
By next year, the current primary might be the worst, but their 2014 campaign has playoffs written all over it.
Best:
 1997-2002: .503 Winning %
Modernization seemed to work in Toronto, but the playoffs weren't on their side in this stretch.
The National League will come in the next week or two.
Best:
As you can see, its only a .005 difference between the two logos, but here lies 10 World Championships and the source of the Curse of Bambino.
OAKLAND ATHLETICS
Worst:
A bad stretch and a lot of nobody's has still resulted in Oakland having a worse logo in winning ways, only to improve after this years fantastic campaign.
Best:
A very similar logo to the one above, here lies 3 straight World Series & one Championship. Maybe a Fingery mustache....
SEATTLE MARINERS
Worst:
Being an expansion club, it definitely took a few years for the Mariners to get off the ground. But that trident still rules.
Best:
The current Mariner logo houses one of the best seasons ever seen in this generation. The 2001 team mustered an impossible 116-win season, tied with the 1906 Chicago Cubs for the greatest season in baseball history. They also hosted the All-Star Game that year with 6 all-stars of their own.
TAMPA BAY RAYS
Worst:
It took quite awhile for any significant progress to be made in the Trop. Despite having Fred McGriff, Aubrey Huff & Randy Winn, wins didn't abide here.
Best:
Maybe knocking the devil out of Tampa helped a bit. 2008 featured a World Series appearance against the Phils, but still no championships.
TEXAS RANGERS
Worst:
This losing stretch had itself some fun though, hosting the Ryan Express from 1989-1993.
Best:
Ron Washington has mostly had his ways in Arlington, recently making 2 straight World Series appearances while having ownership issues.
TORONTO BLUE JAYS
Worst:
By next year, the current primary might be the worst, but their 2014 campaign has playoffs written all over it.
Best:
Modernization seemed to work in Toronto, but the playoffs weren't on their side in this stretch.
The National League will come in the next week or two.
No comments:
Post a Comment